
Cycle Low Assessment: Has the Bottom Already Formed?
Key takeaway: Several indicators point to an advanced but not yet completed correction phase. The historical extreme readings that reliably marked previous cycle lows (2018, 2022) have not been reached so far. At the same time, sentiment and cost-basis data suggest a late bear-market phase. We therefore assume an ongoing but not yet completed bottoming process.
1. Executive Summary
Bitcoin is trading at around $61,300 in early July 2026, down approximately 27% year-to-date and roughly 51% below its all-time high of about $126,000 (October 2025). This analysis condenses the key on-chain metrics from publicly available models (MVRV Z-Score, True Market Mean, Puell Multiple, profit/loss distribution, sentiment) into an assessment of whether the Bitcoin market has already formed a cycle bottom or whether a further low lies ahead.
Key takeaway: Several indicators point to an advanced but not yet completed correction phase. The historical extreme readings that reliably marked previous cycle lows (2018, 2022) have not been reached so far. At the same time, sentiment and cost-basis data suggest a late bear-market phase. We therefore assume an ongoing but not yet completed bottoming process.
2. Market Overview
2.1 Price Development
Following the cycle high of about $126,000 in October 2025, Bitcoin has been in a structural correction. The current drawdown of roughly 50% sits at the lower end of the historical range of previous cycles (94% → 87% → 84% → 77%), which points to a weakening but intact four-year cycle pattern with declining amplitude.
2.2 Macro Context
- Capital rotation toward the AI/tech sector is identified by on-chain models as a drag on Bitcoin — capital is flowing into higher-growth narratives.
- Overall market sentiment is exceptionally weak; market participants describe a phase of "extreme apathy" within the Bitcoin community.
- Valuations across the broader risk-asset universe (including big tech/AI IPOs) are increasingly being questioned, pointing to a late-cycle macro environment.
3. On-Chain Metrics at a Glance
The following table compares the current readings of the most important on-chain indicators with their historical bottom levels. Each metric includes a brief definition to facilitate interpretation:
| Metric | Current Value | Historical Bottom | Interpretation |
|---|---|---|---|
| MVRV Z-Score Valuation of the market price relative to the average on-chain cost basis | ≈ 0.20 | < 0 (deep red) | Near fair value, not extreme |
| Puell Multiple Daily miner revenue relative to the 365-day average | ≈ 0.75 | ≈ 0.30 | Miner stress elevated, not extreme |
| Price vs. True Market Mean Comparison with the average cost basis of all active market participants (~$81k) | Below | in previous cycles at times breached more significantly | Point of observation, not an extreme signal |
| Supply in Loss Share of circulating BTC supply (coins) currently trading below its last purchase price | ≈ 50% of supply | > 50% for weeks | Advanced, not final |
| Capital invested at higher prices Share of deployed capital (USD) invested at prices above current levels | ≈ 80% | typically high at the bottom | Market remains "top-heavy" |
| Sentiment Qualitative assessment of market sentiment | Extremely negative ("apathy") | Extreme readings at the bottom | Consistent with late phase |
Source: public on-chain and market data (as of early July 2026).
4. Detailed Analysis by Category
4.1 Pricing Models (MVRV Z-Score, True Market Mean)
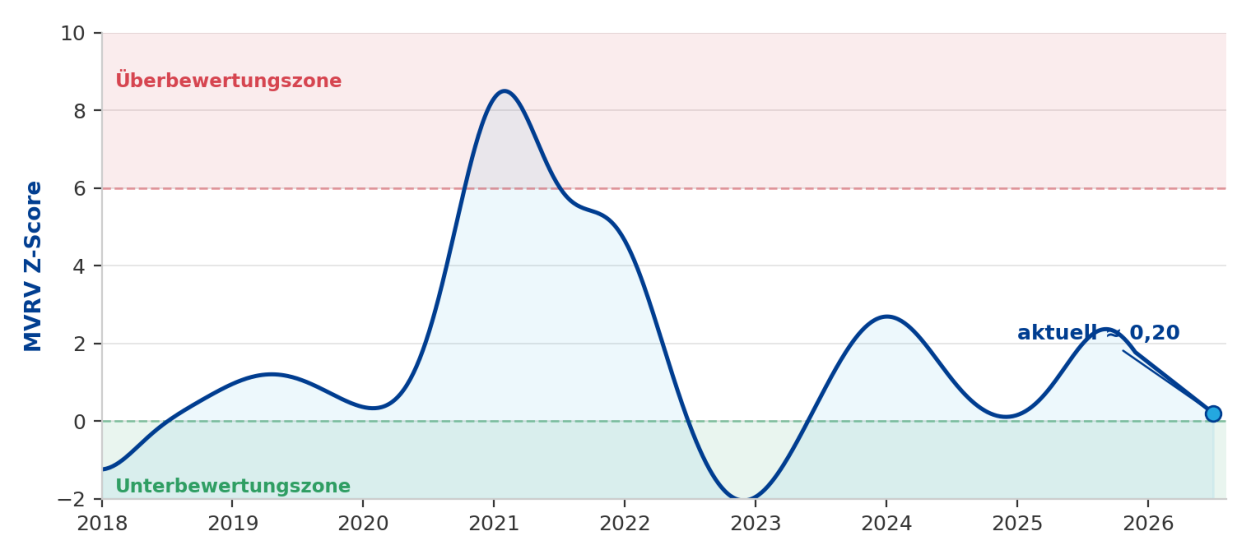
The MVRV Z-Score stands at around 0.20 and is thus close to fair on-chain value (realized value). Historical cycle lows were only reached at clearly negative Z-Score readings. Notably, the price is trading below the True Market Mean (about $81,000), the average cost basis of all active market participants. This point deserves attention but should be placed in historical context. A temporary breach of the True Market Mean also occurred in earlier, non-final correction phases and, on its own, is not an extreme signal but a point of observation.
4.2 Profit/Loss Distribution (NUPL, Supply in Loss)
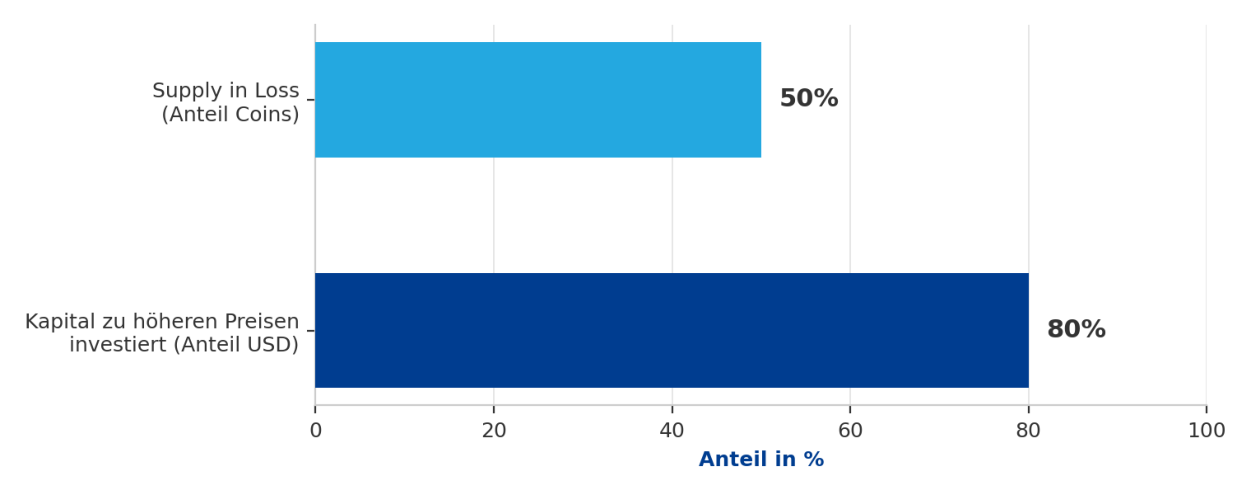
To interpret the following two metrics, the distinction matters: "Supply in Loss" measures the share of the circulating Bitcoin supply (i.e., the number of coins) currently below its respective on-chain purchase price — a view of the breadth of the loss zone. "Capital invested at higher prices," by contrast, measures what percentage of total deployed capital (in USD) was invested at a price above the current level — a view of the economic weight behind those coins. The two metrics complement each other. Roughly half of the circulating supply is currently in a loss position, while about 80% of total invested capital was deployed at prices above today's level. The fact that the capital share is significantly higher than the coin share shows that it is disproportionately the later, larger or more expensive purchases that are currently underwater. This pattern of a "top-heavy" market is typical of the middle to late phase of a bear market. Historically, a final bottom only forms once a large portion of these weak hands has capitulated.
4.3 Mining Economics (Puell Multiple)
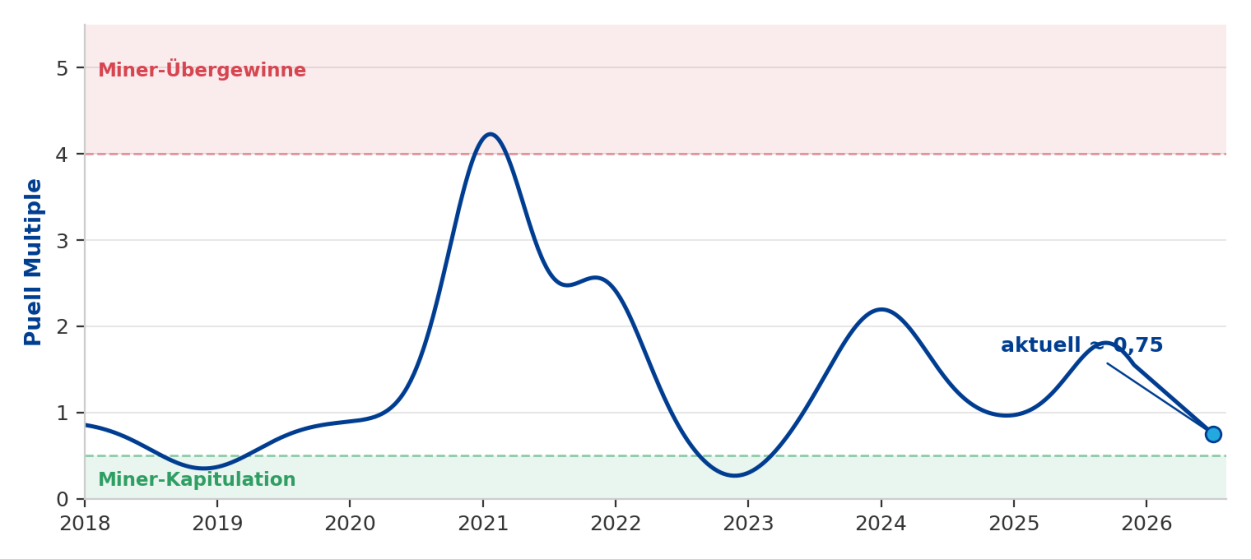
The Puell Multiple stands at around 0.75. Historical cycle lows coincided with readings around 0.30, the point of maximum miner stress. The current level signals elevated but not yet extreme pressure on miner economics. A full miner capitulation cycle may therefore still lie ahead.
4.4 Sentiment & Behavioral Data
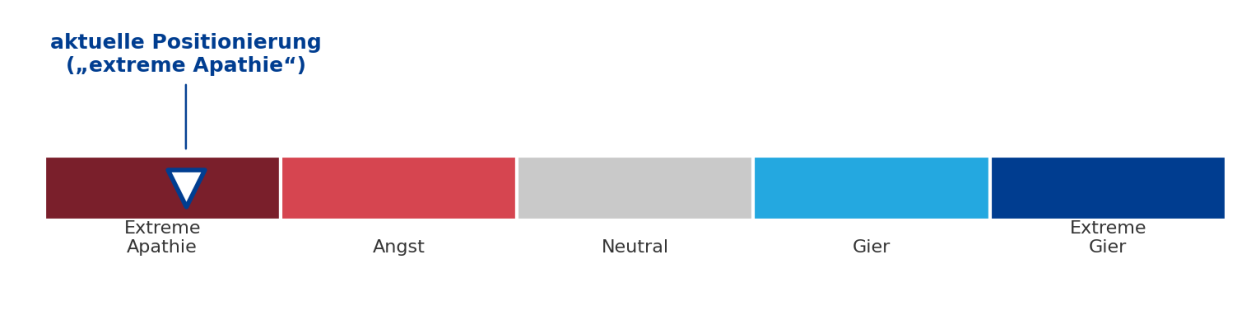
Qualitative sentiment indicators show a level of "extreme apathy" that is consistent with late bear-market phases. At the same time, this has not so far translated into a final, panic-driven capitulation in the hard on-chain metrics. Market observers themselves describe the market move as comparatively "orderly," not as a disruptive forced-selling event like 2018 or 2022.
5. Scenario Analysis
Based on the current data, three plausible scenarios emerge for the further course:
| Scenario | Description | Indicative Range |
|---|---|---|
| A – Bottom is already in | The price drawdown is structurally smaller in this cycle (declining amplitude: 94%→87%→84%→77%→ possibly 60–70%). The current level already marks the low. | ≈ $55,000–62,000 |
| B – Final capitulation phase still to come | On-chain extreme readings (MVRV Z-Score, Puell) only reach historical bottom levels after a further, sharper wave of selling. | ≈ $40,000–50,000 |
| C – Structural break / new dynamic | Institutional capital rotation (including toward AI/tech) permanently alters the cyclical structure; classic on-chain thresholds lose discriminatory power. | Cannot be modeled |
Indicative ranges are based on publicly discussed target zones and are not price forecasts.
6. Assessment & Implications
- Based on current data, a bottom cannot be considered fully confirmed. Key on-chain extreme readings (MVRV Z-Score, Puell Multiple) have not yet reached historical trough levels.
- The combination of structurally high "top-heaviness" and extremely negative sentiment points to a late but not completed bear-market phase.
- Our Investment Committee recommends a staggered, data-driven approach (e.g., a scale-in strategy across multiple price zones) rather than a single-entry positioning based on an individual bottom signal.
- The development of the MVRV Z-Score, Puell Multiple and supply in loss should be monitored closely over the coming 4–12 weeks, as these have historically been the most reliable leading indicators of a final bottoming process.
Disclaimer
This report is for information purposes only and does not constitute investment advice, an offer or a solicitation to buy or sell digital assets. All data are based on publicly available on-chain sources as well as publicly available market data and have been compiled to the best of our knowledge; no warranty is given as to completeness or timeliness. The charts in Section 4 are schematic, illustrative visualizations intended to depict the patterns described and do not represent exact price data. Historical patterns are not a reliable indicator of future developments. Investment decisions should always be made on the basis of an independent review and, where appropriate, with the involvement of independent financial and legal advice.
Translated from the German original; the German version prevails. Read the German version