Inflection Point: Has the Market Seen Its Cycle Low?
Key takeaway: The probability that the market has already put in its cycle low has risen markedly since July. Final confirmation would be a sustained close above $80,000-82,000. In the near term, the market is watching an important political vote in the US on September 15; over the medium term, the US midterm elections in November (Section 6).
1. Executive Summary
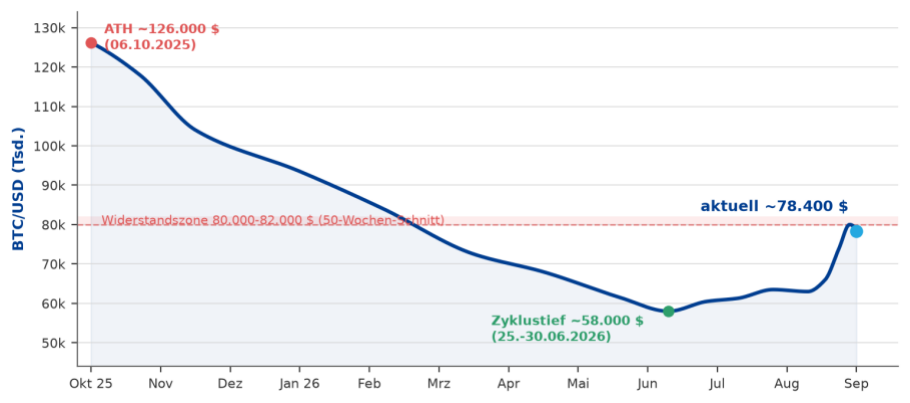
Bitcoin is trading at around $78,400 at the end of August 2026 - up roughly 24% in August alone, the strongest August since 2017. From the late-June low of just under $58,000, that is a gain of roughly 35%. It still stands about 38% below the record high of around $126,000 (October 2025), however.
Already in the July report we assumed that the market was in the process of forming a bottom - possibly in the $55,000 to $62,000 range. That is exactly where the June low came in. Since then the price has reclaimed several important technical levels that are frequently read as a signal of a trend reversal.
The recovery is not limited to Bitcoin: Ethereum gained roughly 32% in August and thus outperformed Bitcoin for the first time this year. Smaller cryptocurrencies (altcoins) also added roughly $215 billion in combined value during the strongest week of the rally - though selectively: projects with real revenues were the main beneficiaries (Section 5).
Key takeaway: The probability that the market has already put in its cycle low has risen markedly since July. Final confirmation would be a sustained close above $80,000-82,000. In the near term, the market is watching an important political vote in the US on September 15; over the medium term, the US midterm elections in November (Section 6).
2. Market Overview
2.1 Price Development: From the June Low to the Breakout Attempt
The June low of just under $58,000 represented a decline of roughly 54% from the record high - the mildest drawdown in the history of Bitcoin cycles. After a few quiet weeks, the recovery accelerated in mid-August: the price rose from around $62,000 to just under $80,000 within a week - the second-largest weekly gain of the past five years.
2.2 Quality of the Advance: Spot Demand Underpins the Leverage-Driven Push
More important than the size of the advance is its quality. Three observations argue that this is a genuine trend reversal and not merely a brief countermove:
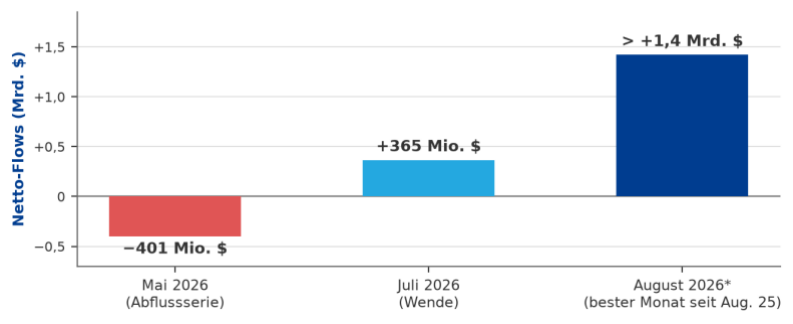
- Institutional money is flowing back: Exchange-traded Bitcoin funds (ETFs) in the US recorded roughly $3.5 billion in new inflows in August - the strongest month of the year (July: only around $0.2 billion).
- Not an advance on credit, but a leverage-driven start: In mid-August, bets on falling prices worth roughly $2.8 billion were forcibly liquidated within 45 hours (a so-called "short squeeze"). The first leg of the advance was therefore a leverage event. What matters is what came next: instead of a relapse, spot ETF inflows of more than $2 billion in the squeeze week alone held the level - the advance was thus underpinned by real buying, not by fresh speculation on credit.
- Broad buyer base: Since the beginning of August, virtually all investor groups have been adding - from retail investors to large investors. Only 6.6% of all Bitcoin now sits on trading venues ready for immediate sale, the lowest level in roughly seven years.
2.3 Macro Context
- Liquidity: The expansion of US Treasury buybacks in longer maturities dampened yields and is regarded as the immediate trigger of the squeeze week.
- Politics: The US administration's support for the market-structure legislation (CLARITY Act) provided the narrative spark for the upward move (Section 6).
- Monetary policy: Following Kevin Warsh's Jackson Hole speech, however, rate expectations have tightened considerably. Markets currently price a roughly 60% probability of a 25 basis point rate hike in September. This is more of a headwind for risk assets.
3. On-Chain Metrics: July vs. Today
The following table compares selected market metrics from the July report with the current reading:
| Metric | July 2026 | End of August 2026 | What does it mean? |
|---|---|---|---|
| MVRV Z-Score Market price relative to on-chain cost basis | ≈ 0.20 | 0.42 (Aug 8, before the advance)¹ | Already fairly valued again before the August advance; after the advance the reading is correspondingly higher - no sign of extreme undervaluation as in earlier bear markets. |
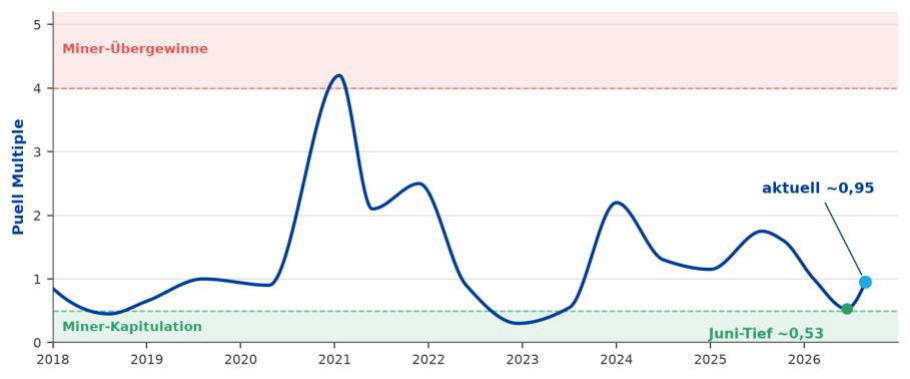
| Puell Multiple Miner daily revenue vs. 365-day average | ≈ 0.75 | ≈ 0.95 (June low: ~0.53) | The most difficult phase for Bitcoin "miners" is over; conditions are normalizing. |
| Price vs. True Market Mean Cost basis of active market participants | below | narrowly reclaimed (~$76,000-77,000) | The price is back above what the average investor paid - a positive signal. |
| Supply in Profit Share of BTC supply above purchase price | ≈ 50% | ≈ 69% | Considerably more investors are back in profit rather than in loss. |
| NUPL Net unrealized profit/loss | ≈ 0.16 | ≈ 0.32 - above the 365-day average | Markedly improved and back above its own annual average - historically often a precursor to rising prices. |
| Sentiment Fear & Greed classification | "extreme apathy" (15-24) | Neutral to greed (51-78) | From extreme fear to cautious optimism - but not yet euphoria. |
¹ Last confirmed reading (Aug 8); as of Aug 31, 2026.
4. Bitcoin in Detail
4.1 Back Above Cost Basis: The Ladder Is Almost Climbed
Over the past weeks the Bitcoin price has reclaimed several important technical levels: the 200-week moving average, the cost basis of short-term holders, the 200-day moving average (for the first time in 270 days) and - narrowly - the average entry price of all active market participants.
Notably: the average entry price of all Bitcoin ever purchased (around $53,000) was never breached in this cycle - unlike at the earlier lows in 2015, 2018 and 2022. The market may therefore have formed its bottom above its own cost basis.
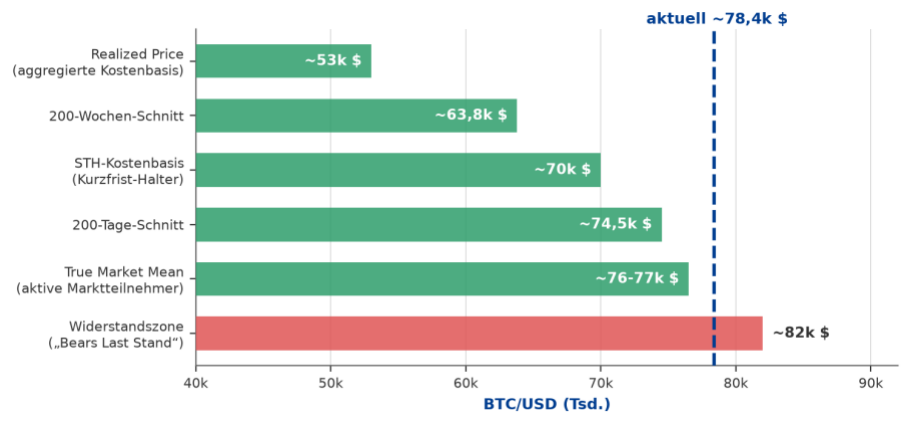
Glassnode / Checkonchain, mid/late August 2026.
4.2 Profit/Loss Distribution: Capitulation Pressure Has Eased
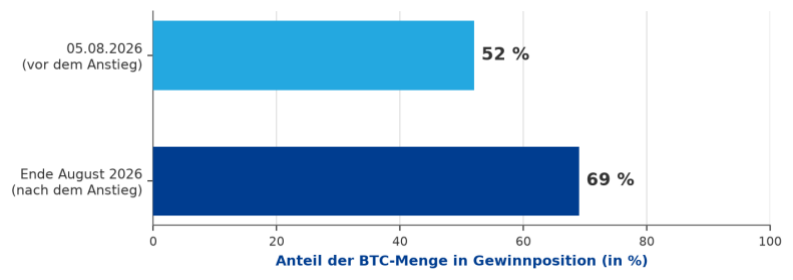
The distribution of profits and losses has also eased considerably: the share of Bitcoin in profit rose from 52% at the beginning of August to around 69% at the end of August. Selling panic remained moderate in the process - unlike at earlier lows (2018/2022), no extreme investor capitulation was reached. That points to a broader, more stable investor base (including ETFs and corporates) that dampens price swings.
Long-term holders also took profits again for the first time recently - typical behavior at turning points and, in itself, not a warning signal, as long as new demand (above all via ETFs) absorbs these sales. That was precisely the case in August.
4.3 Mining Economics: Miner Capitulation Complete, Hash Ribbon Buy Signal Active
Bitcoin "miners" - the companies that create new Bitcoin through computing power - have also put the most difficult phase behind them. Their revenues fell to one of the lowest levels in history at the start of June, but have recovered noticeably since. Historically, similarly low readings were followed on average by price gains of around 55% over the subsequent six months.
4.4 Sentiment: From "Extreme Apathy" to Neutral/Greed - Without Euphoria
Investor sentiment has turned as well: the "Fear & Greed Index" jumped from extreme fear at the beginning of June to greed at times in late August. A sustained euphoria phase, of the kind that typically marks interim highs, has not been reached so far.

5. Ethereum & the Broader Market
The recovery is not a purely Bitcoin phenomenon. In August it broadened out to Ethereum and parts of the altcoin market - with projects offering institutional access and real revenues benefiting most.
5.1 Ethereum: Deeper Trough, Sharper Recovery
Ethereum fell considerably further than Bitcoin in this cycle (-69% from the high) and has since recovered more forcefully as well: from around $1,512 at the June low to roughly $2,490 currently (+64%). Ethereum has thus outperformed Bitcoin for the first time this year.
The main driver was the turnaround in Ethereum ETFs: after record outflows in May, roughly $1.85 billion flowed in during August - the best month in over a year. In addition, since 2026 investors have been able to participate in Ethereum "staking" yields via certain ETFs (around 2% per year net) - a new argument for institutional investors.
Corporates are also continuing to build their Ethereum holdings, tying up additional supply. It remains an open question whether the brisk network usage will be reflected more strongly in the Ethereum price going forward.
5.2 Altcoin Market: Rotation Yes - Altseason (Not) Yet
Smaller cryptocurrencies also advanced: in the strongest week of the rally, the entire altcoin market gained roughly $215 billion in value. The move was led by projects such as XRP, Hyperliquid and Chainlink, which rose more than Bitcoin.
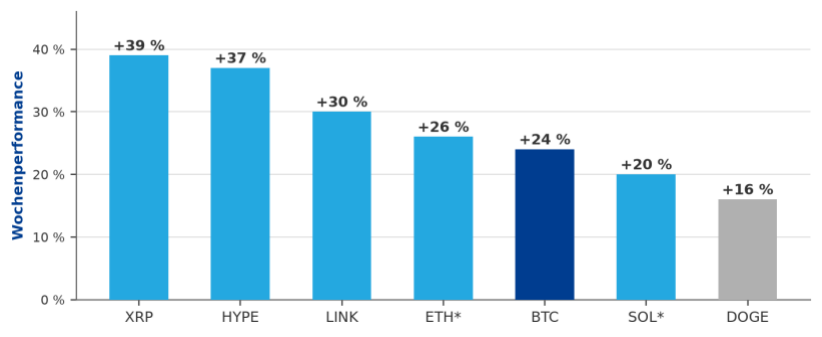
According to the common indicators, however, one cannot yet speak of a broad "altseason" - that is, a rally across virtually all cryptocurrencies; Bitcoin remains dominant. Our assessment: this is more a selective rotation into liquid projects with institutional access than a broad rally like 2021.
5.3 The Revenue Era: Substance Behind the Rotation
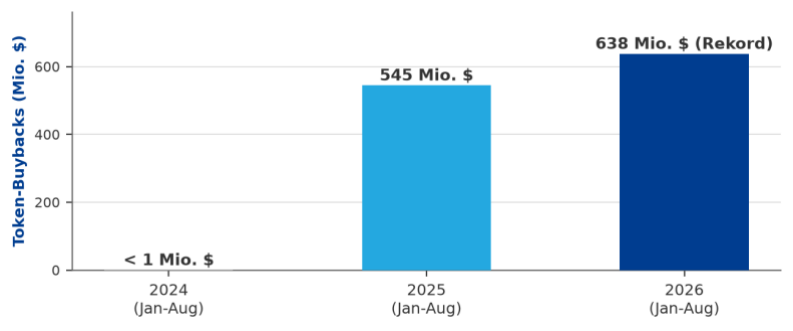
One structural difference from earlier cycles: more and more crypto projects are generating real, measurable revenues - and returning part of them to token holders, similar to share buybacks at listed companies. These so-called "token buybacks" reached a record $638 million from January to August 2026 - roughly 17% more than in the same period of 2025 ($545 million) and a multiple of the less than $1 million in 2024. Around 90% of that is accounted for by just two projects:
| Protocol | Revenue (most recent) | Capital returned |
|---|---|---|
| Hyperliquid | $419 million in gross fees in H1 2026; ~63% of perp DEX open interest (Aug.) | ~99% of fees into buyback/burn; ~$370 million Jan.-Aug. 2026 (Allium), ~$1.3 billion cumulative since launch (~5-7% of market value p.a.) |
| pump.fun | $33.7 million in protocol revenue (30 days, as of Aug 9); daily fees highest since Sep. 2025 | $370 million burn (36% of circulating supply, April); 50% of net revenue firmly committed to buybacks |
Sources: Allium Labs/FT, CoinMarketCap, CryptoBriefing, The Block, Messari, The Defiant, DL News (August 2026).
Important: high revenues alone do not guarantee good price performance - the issuance of new tokens ("dilution") remains a counterargument. Projects with clean return mechanics, such as the two named above, have nonetheless been clearly rewarded by the market so far.
6. Catalysts: September 15 and the Midterms
6.1 CLARITY Act - Putting the September 15 Vote in Context
On September 15, 2026, the US Senate votes on a first procedural step toward the CLARITY Act - legislation intended to create clear rules for the crypto market. This is not yet about final passage, only about whether the bill will be debated in the Senate at all.
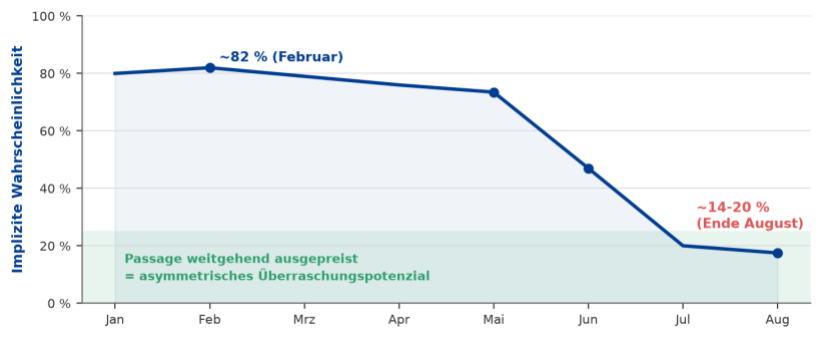
Important for investors: prediction markets now put the probability of success at only 14-20% (in mid-February it was still 82%) - a failure is therefore largely priced in. Success, by contrast, would be a positive surprise. Several market observers also emphasize that a failure should not pose a major risk to Bitcoin either.
6.2 Midterms in November: A Historical Pacesetter
September 15 is at the same time the last chance to move the legislation before the US midterm elections in November.
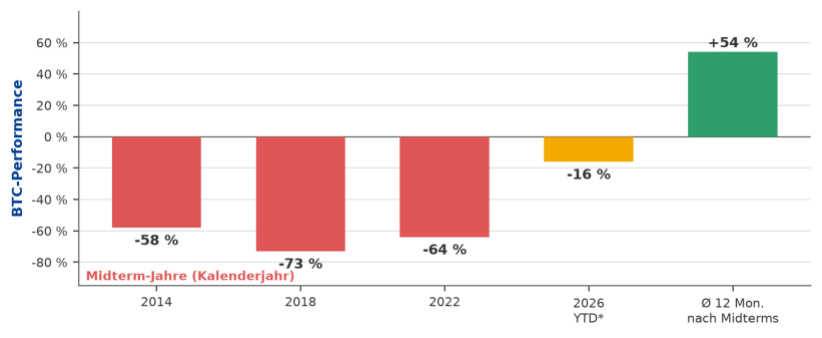
Regardless of the election outcome, history shows a striking pattern: the election year itself has mostly been weak for Bitcoin (2014: -58%, 2018: -73%, 2022: -64%) - whereas the twelve months thereafter were on average clearly positive (according to Binance Research, roughly +54% on average). So far, 2026 is following this pattern (as of Aug 31: around -11% year to date).
6.3 Structural Tailwinds Beyond the Key Date
- GENIUS Act: New US legislation for "stablecoins" (value-stable cryptocurrencies) already in force; that market has grown by more than 50% since 2025 to roughly $310 billion.
- Retirement provision: US authorities intend to open cryptocurrencies to the roughly $10 trillion retirement market.
- Bank custody: US banks will officially be permitted to hold cryptocurrencies in custody for clients.
- Supervision: The US Securities and Exchange Commission (SEC) is signaling a more constructive stance toward the industry overall.
- Access: Large providers such as Charles Schwab are expanding their offering to include additional cryptocurrencies.
7. Scenario Analysis
| Scenario | Description | Indicative range (BTC) |
|---|---|---|
| A - Inflection confirmed, bull market begins | Sustained weekly close above $80,000-82,000 - triggered, for example, by a positive surprise on Sep 15 or persistent ETF inflows. Next target zone $82,000-86,000, above that opening toward $90,000+. | > $82,000, then $90,000+ |
| B - Consolidation within the range | The September 15 vote fails (largely priced in); the market consolidates between $70,000 and the resistance zone. The bottoming thesis remains intact, catalysts shift to the Fed's rate path and the midterms. | ≈ $70,000-82,000 |
| C - Invalidation | Sustained relapse below the June low of around $58,000. The bear-market thesis outlined in July would be back on the table; altcoins would, based on experience, correct disproportionately. | < $58,000 → $40,000-50,000 |
The ranges cited are indicative and are not price forecasts.
8. Assessment & Implications for Action
- The probability that the market already saw its cycle low in June at around $58,000 has risen markedly since July. Final confirmation would be a sustained weekly close above $80,000-82,000.
- The quality of the advance - carried by real buying rather than speculation on credit - distinguishes it structurally from the short-lived relief rallies of the 2022 bear market.
- A similar bottoming thesis applies to Ethereum - with a deeper decline and, so far, a more forceful recovery. That improves the risk-reward profile relative to Bitcoin.
- For altcoins, selection remains decisive: we prefer liquid projects with real revenues and institutional access over a broad, unselective investment.
- September 15 is a single but asymmetrically priced event. Our Investment Committee advises against positioning the portfolio around this single event - a staggered, data-driven approach (scaling in across price zones) remains the recommended implementation.
- Over the coming weeks we will be watching above all: weekly closes relative to $80,000-82,000, the development of ETF inflows (BTC, ETH), as well as the outcome of the September 15 vote and the November midterm elections.
Disclaimer
This report is for information purposes only and does not constitute investment advice, an offer or a solicitation to buy or sell digital assets. All data are based on publicly accessible on-chain sources as well as publicly available market data and have been compiled to the best of our knowledge; no warranty is given as to completeness or timeliness. The charts marked as schematic are illustrative visualizations intended to convey the patterns described and do not represent exact price data. Historical patterns are not a reliable indicator of future developments. Investment decisions should always be made on the basis of an independent review and, where appropriate, with the involvement of independent financial and legal advice.
Translated from the German original; the German version prevails. Read the German version